Previously, I discussed how to make Xcode’s ‘Assistant Editor’ less frustrating when writing Swift. Another trick I learned recently involves using Xcode Behaviors to improve the debugging experience.
My typical (and the default) experience in Xcode when debugging would be something like the following. I’ve found a problem I need to debug and I setup a few breakpoints to investigate. As soon as the first breakpoint is triggered, my app pauses, and Xcode jumps the currently active editor to the breakpoint that’s been hit. Sometimes I need to open the bottom panel manually to display the console if it wasn’t already showing. Sometimes I’ll need to manually adjust showing the ‘Variables View’ and ‘Console View’ together, or only one. I step through the debugger, examine the state of my app, debug all the things, etc. If it is a more complicated issue, I’ll like have multiple breakpoints and be jumping around the code, across multiple files a lot.
When finished, I end the debugging session, only to find that Xcode leaves me where the debugging ended. My editor is viewing whatever file and line of code that the instruction pointer was last pointing to in LLDB. The ‘Variables View’ and ‘Console View’ are still showing, though now blank. I’ve lost all context of where I was writing code, before I started debugging. It can be incredibly frustrating.
Long ago, I started opening a new tab to mitigate this. That way, I could simply close it when I was finished debugging, and pick up where I left off writing code. Though, each debugging session still started the same way. I needed to manually open a new tab, show the Console, hide the sidebar, etc. However, there is a much better way to achieve this using Xcode Behaviors.

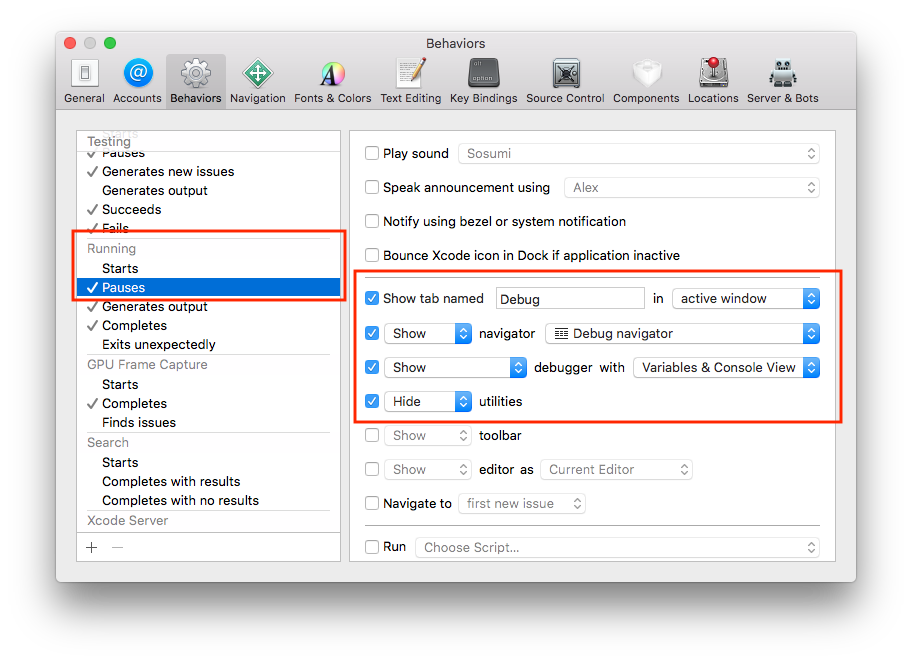
Xcode Behaviors settings
In Xcode’s preferences, go to the Behaviors tab. Navigate to the ‘Running’ section and click ‘Pauses’. Here you can instruct Xcode to open a new tab by checking the box for ‘Show tab named’ and giving it a name. By default, showing the ‘Debug Navigator’ should be enabled. Next, I like to show the debugger with the ‘Variables & Console View’, as well as hide the Utilities sidebar on the right.
This is amazing, and I can’t believe I didn’t know about this before. With these settings, when a breakpoint is triggered, Xcode now opens a new tab with the editor configured (automatically!) exactly how I want. When I’m finished debugging, I can close that tab and quickly resume working where I left off. Xcode Behaviors are a powerful feature and I’ll be customizing others now.
Thanks to Chris Miles for sharing this during his WWDC 2018 talk, Advanced Debugging with Xcode and LLDB. This was only a minor comment he made. Of course, he also provided so many more great tips on using LLDB effectively and efficiently. It was one of my favorite talks this year. You should check it out.